Identify and Plot Points on a Coordinate Plane
Students will be able to identify, plot, and label points, axes, and quadrants on a coordinate plane.
|
Write the definition of the following words in your math journal:
Linear In a straight line. Point An exact location. It has no size, only position. Drag the points below (they are shown as dots so you can see them, but a point really has no size at all!) Points usually have a name, often a letter like "A", or even "W" Standard Form A general term meaning "written down in the way most commonly accepted" Axis: An imaginary line around which something rotates Linear Equation
An equation that makes a straight line when it is graphed.
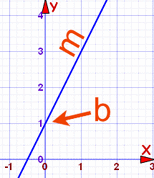
Often written in the form: y = mx+b X Axis
The line on a graph that runs horizontally (left-right) through zero.
It is used as a reference line so you can measure from it. Y Axis
The line on a graph that runs vertically (up-down) through zero.
It is used as a reference line so you can measure from it. Origin
The starting point.
On a number line it is 0 On a two-dimensional graph it is where the X axis and Y axis cross, marked (0,0) on the graph here: In three dimensions it is the point (0, 0, 0) Coordinates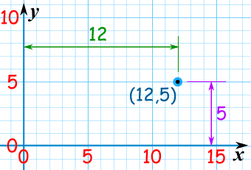
Coordinates are a set of values that show an exact position.
On maps and graphs it is common to have a pair of numbers to show where a point is: the first number shows the distance along and the second number shows the distance up or down. Example: the point (12,5) is 12 units along, and 5 units up. But there are other types of coordinates, such as polar coordinates and 3 dimensional coordinates. |
Ordered Pair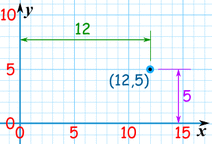
Two numbers written in a certain order.
Usually written in parentheses like this: (4,5) Can be used to show the position on a graph, where the "x" (horizontal) value is first, and the "y" (vertical) value is second. Here the point (12,5) is 12 units along, and 5 units up. Slope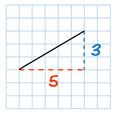
How steep a straight line is.
In this example the slope is 3/5 = 0.6 Axes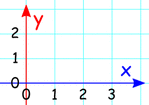
Plural of Axis.
Usually means the "x" and "y" lines that cross at right angles to make a graph. Coordinate Plane

The plane containing the "x" axis and "y" axis.
Graph
A diagram of values, usually shown as lines or bars.
Intersect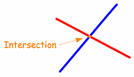
To cross over (have some common point)
The red and blue lines intersect. Rise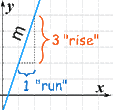
How far a line goes up (for a given distance along).
Rise/Run gives you the slope of the line. Run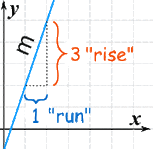
How far a line goes along (for a given distance going up).
Rise/Run gives you the slope of the line. Plot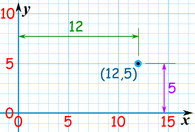
To draw on a graph or map.
Here we have plotted the point (12,5) |
